


 |
||
|
News Downloads Screen Shots High Scores How To Play Version History Support |
||
 |
||
|

![]()
|
You can find a lot of information in the graphs section. Graphs are handy for keeping track of nearly everything in the game. Sets of graphs can be made to automatically appear at the start of each turn to show information you need. General Information: 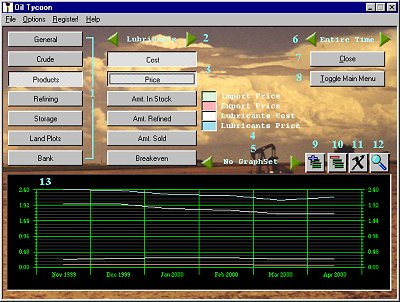 1. Categories: These are all the categories
of graphs available. Click on one of these buttons to display all of
the available graphs in that section. 2. Products / Counties: Click the green
arrows to switch between the products and counties. This is only
displayed in the Products and Land Plots categories. All of the
items in each of those sections depends on the currently selected
item. If you are in the Products section, Lubricants is selected,
and you click Cost, a graph of the cost of Lubricants will be
displayed. 3. Category graphs: This is a list of all of
the graphs in the current category. Click on one of these buttons to
display the graph. You can display up to 6 items in the graph
below. 4. Legend: This is a legend of the graphs
that are currently displayed in the graph below. The colored boxes
correspond to the color of the graph. Left-click on the item to
highlight it in the graph below. Right-click on it to remove it from
the current set of graphs. 5. Graph Sets: Click the green arrows to select the graph set to view. See the section "Graph Sets" below for more information. 6. Time to View: Click the green arrows the change
the time of the graph. There are five options: Entire Time, 6 Months,
1 Year, 3 Years, and 5 Years. Entire Time displays the selected
graphs over the entire time you. ve played the game. The
other options show the graph over the past 6 months, 1 year, 3
years, or 5 years. 7. Close button: Closes the current screen
and returns you to the main menu. 8. Toggle Main Menu: Opens the main menu
without closing the current screen. If the main menu is
already shown, clicking this button will hide the main
menu. 9. Add Graph Set: Adds a new graph set based on the currently selected graphs. You cannot have more than 10 graph sets. See the section "Graph Sets" below for more information. 10. Remove Graph Set: Removes the currently selected graph set. See the section "Graph Sets" below for more information. 11. Clear All: Removes all of the currently
selected items from the graph at the bottom. 12. Magnify: Enlarges the graph at the bottom
to fill the entire screen. See the section "Full Screen Graph" below
for more information. 13. Graph: The graph that displays all of the
currently selected items. You can select the items to display in the
graph by selecting items from the various categories. The legend
shows which color corresponds to which item. Full Screen Graph: 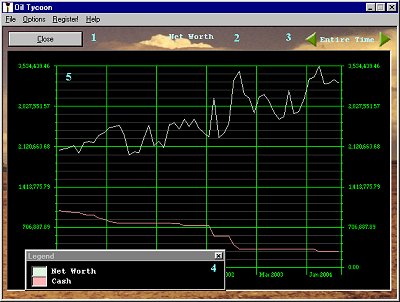 The full screen graph will be displayed whenever you click on the Magnify button in the graphs screen, if you have designated a graph set to appear at the start of every turn. Below is a description of the screen: 1. Close / Shrink button: The Shrink button
(which looks similar to the Magnify button) brings the graph down to
normal size after you have enlarged it. When a graph set is
displayed automatically at the start of a turn, the Shrink button is
replaced by the Close button, which closes the Graph Sets screen. 2. Graph Set: (only shown on the graph set screen at the start of a turn) Displays the title of the current graph set, and if there is more than one graph set, presents green arrows which you can use to switch between them. Only graph sets you have specified will be available. See the section "Graph Sets" below for more information. 3. Time to View: Click the green arrows the change the
time of the graph. There are five options: Entire Time, 6 Months, 1
Year, 3 Years, and 5 Years. Entire Time displays the selected graphs
over the entire time you've played the game. The other options show
the graph over the past 6 months, 1 year, 3 years, or 5
years. 4. Legend: This is a legend of the graphs that are
currently displayed in the graph below. The colored boxes correspond
to the color of the graph. Left-click on the item to highlight it in
the graph below. Right-click on it to remove it from the current set
of graphs. 5. Graph: The graph that displays all of the currently
selected items. You can select the items to display in the graph by
selecting items from the various categories. The legend shows which
color corresponds to which item. Graph Sets: You can groups several graphs together to form a graph set. Graph sets are a way to organize graphs into groups you use often. For example, a graph set may display the net worth vs. cash, oil received from importing vs. oil from wells, or comparisons between the selling prices of all the crude products. You can have up to 10 graph sets, each with 6 separate items. To create a new graph set, make sure you have "No Graph Set" selected, and select the items you would like to display in the graph set. Then, click the Add Graph Set button, type in a name, and click OK. You now have a new graph set! You can modify which items are displayed by selecting and deselecting them while the graph set is shown. Finally, you can remove a graph set while it is selected by clicking the Remove Graph Set button. Graph sets can also be made to display automatically at the start of every turn. You can view quick statistics on the selling price of refined goods, import / export prices of crude, etc. every time you start a new turn to keep updated on sudden jumps. To make a graph set that will appear at the start of every turn, create a new graph set with the "Show at the beginning of every turn" option selected. You can use and view the graph set as any other. Categories and Individual Graph Items: General :Crude :
Products:
Refining :
Storage :
Land Plots:
Bank :
|
